Trade Guides
HVAC Callback Rate: How to Measure and Reduce Callbacks (HVAC, Plumbing, Electrical)
8 min readJobOpsPro Editorial Team
Define a callback, calculate your callback rate, price what each repeat visit costs, and run a 15-minute weekly review. Worked examples and tables for HVAC, plumbing, and electrical shops.
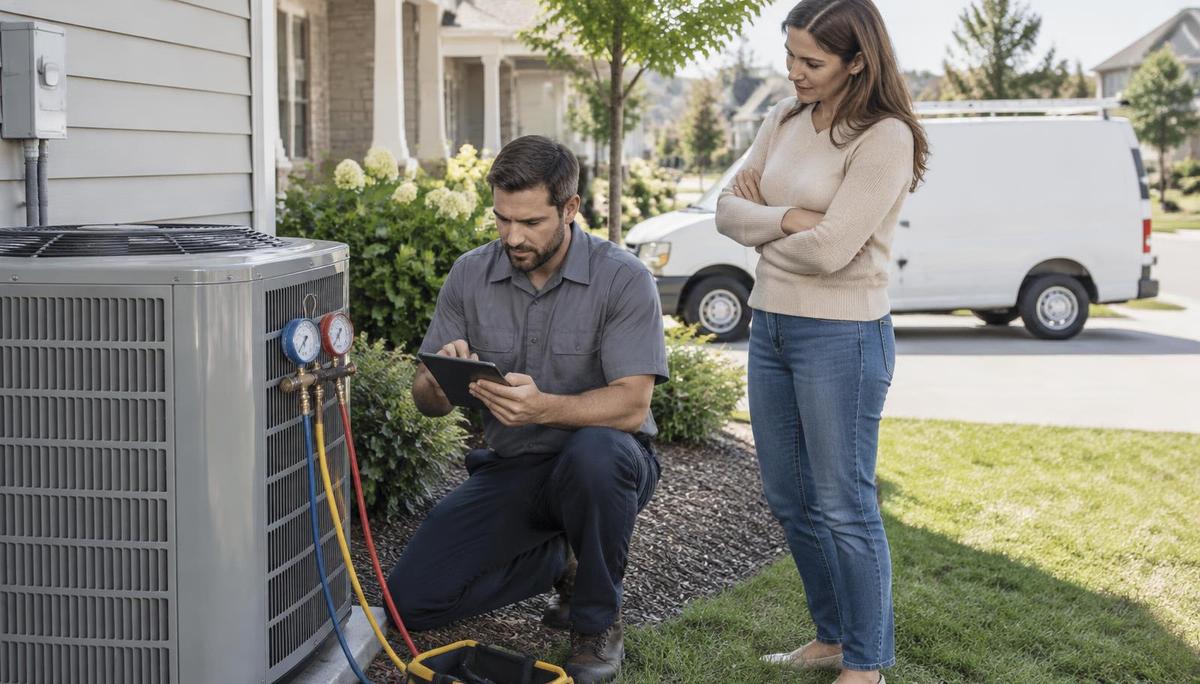
HVAC callback rate is the share of completed jobs that need an unplanned return visit for the same problem within a set window, usually 30 days for repairs and one year for installs. Calculate it as callbacks ÷ completed jobs × 100, tag every callback with a cause, and review the list weekly to cut repeat visits.
Most shops know callbacks hurt. Far fewer can tell you their number, and fewer still can tell you *why* it is what it is. The reason is usually not effort. It's that the return visit gets booked as a brand-new job, so it never connects back to the original tech, the original repair, or the original part.
This guide gives HVAC, plumbing, and electrical shops one definition, one formula, a cost model, and a weekly review routine that works without an enterprise reporting team.
All figures below are illustrative worked examples, not industry benchmarks or customer data. Plug in your own job counts, labor cost, and average ticket.
What counts as a callback (and what doesn't)?
The fastest way to get a useless callback number is to count every second visit. A callback is a return visit the customer didn't expect and you can't bill for, on the same problem. Planned follow-ups are not callbacks.
| Situation | Callback? | Why |
|---|---|---|
| AC repaired Monday, same no-cool complaint Thursday | Yes | Same fault, same system, inside the window |
| Tech diagnoses, orders a part, returns to install it | No | Planned second visit, customer agreed to it |
| Customer approves a quoted repair after the first visit | No | New, billable work |
| Water heater installed in spring, leaking fitting in fall | Yes | Inside a one-year install window |
| Tune-up in April, unrelated breaker trip in May | No | Different fault; log it as a new job |
| Tech left without restoring power, gas, or water | Yes | Workmanship miss, even if it took five minutes |
Write your definition down once and apply it the same way every month. Changing it quietly is how a "falling" callback rate turns out to be a reclassified one.
How do you calculate callback rate?
Use one formula across every trade:
Callback rate = callbacks in the period ÷ completed jobs in the period × 100
Example: a shop completes 420 service and install jobs in a month and logs 17 callbacks.
17 ÷ 420 × 100 = 4.0% callback rate
Then split the same number three ways. The total tells you there's a problem; the splits tell you where.
| Split | Example result | What it reveals |
|---|---|---|
| By job type | Installs 7.1%, repairs 3.6%, maintenance 1.2% | Which work needs a better close-out checklist |
| By technician | Range of 1.5% to 8.0% across 9 techs | Who needs coaching or a ride-along (not punishment) |
| By trade | HVAC 4.4%, plumbing 3.1%, electrical 2.6% | Where a multi-trade shop should focus first |
Rule of thumb for small samples: a tech with 2 callbacks on 25 jobs shows 8.0%, but that's two events. Look at a rolling 90 days before drawing conclusions about any one person.
What callback window should you use for HVAC, plumbing, and electrical?
Pick a window that matches the work, then hold it fixed. A common setup:
| Work type | Typical callback window | Notes |
|---|---|---|
| HVAC repair | 30 days | Long enough to catch a misdiagnosis in the next hot or cold spell |
| HVAC install or replacement | 12 months | Covers a full heating and cooling season |
| Plumbing repair | 30 days | Drain recurrences often show up within weeks |
| Plumbing install (water heater, repipe) | 12 months | Fittings and connections fail on their own schedule |
| Electrical repair | 30 days | Intermittent faults need time to reappear |
| Electrical install (panel, EV charger) | 12 months | Ties to your workmanship warranty |
If your labor warranty is longer than a year, track those returns as warranty work in a separate bucket so they don't distort the monthly rate.
How much does a callback actually cost?
A callback usually bills nothing, but it still consumes a truck, a tech, and a dispatch slot. In peak season it also displaces a paying job. Here's a worked example:
| Cost line | Example value |
|---|---|
| Fully loaded labor cost per hour | $65.00 |
| Time per callback (drive + on site) | 1.5 hours |
| Labor cost | $97.50 |
| Truck cost (fuel, wear) | $20.00 |
| Parts replaced at no charge | $35.00 |
| Direct cost per callback | $152.50 |
| Paying job displaced (example average ticket) | $350.00 |
| Gross margin on displaced job (example 50%) | $175.00 |
| Total cost when the board is full | $327.50 |
At 17 callbacks a month, that's $2,592.50 in direct cost, or up to $5,567.50 in a month when every callback pushes out a paying job. Over a year, the direct cost alone is about $31,110.
Now the other direction. Cutting the example rate from 4.0% to 2.5% on the same 420 jobs removes about 6.5 callbacks a month (from 17 to roughly 10.5). That's roughly $990 a month in direct cost and about 10 truck hours freed for billable work. Run your own numbers with the labor rate calculator and the job profit calculator.
Why do callbacks happen?
You can't fix what you can't group. Give every callback one cause code at close-out, chosen from a short fixed list. Free-text notes can't be counted.
| Cause code | Example | Typical fix |
|---|---|---|
| Misdiagnosis | Replaced capacitor, failing compressor was the real issue | Required readings before close; ride-along on that job type |
| Workmanship | Loose connection, unrestored gas valve or water supply | Close-out checklist with photo proof |
| Part failure | New part failed early | Track by supplier and part number; claim warranty |
| Incomplete intake | Wrong tech or wrong parts sent | Better intake questions at booking |
| Parts not on truck | Tech had to leave and come back | Truck stock minimums by job type |
| Customer education | Customer called about expected behavior | Walk-through and a written "what to expect" note |
Keep the list to six or seven codes. If more than about 10% of callbacks land in "other," your list is missing a code.
How do you reduce callbacks without adding paperwork?
Target the causes your data shows, not a generic list. These five changes cover most cause codes above:
- Link every callback to the original job. This one step makes every other report possible: original tech, original date, original repair.
- Require proof at close-out on your top two callback job types. For HVAC that's usually readings and a run-time check; for plumbing, a leak check and photo of connections; for electrical, a test result and photo of the panel or device. See photo documentation on service calls.
- Ask four intake questions at booking. Equipment age, symptom timing, recent work by anyone, and warranty or plan status. Better intake sends the right tech with the right parts.
- Set truck stock minimums for repeat parts. "Went to get a part" return trips are the easiest to eliminate. More in truck stock visibility.
- Send the original tech back when you can. They learn the most from the return visit, and the fix goes into the job history where the next tech can see it.
What does a weekly callback review look like?
Fifteen minutes, same day every week, same three questions. Example agenda:
| Step | Time | Question to answer |
|---|---|---|
| Pull the list | 3 min | Which callbacks closed in the last 7 days, with original job linked? |
| Group by cause code | 5 min | Is one cause, job type, or part showing up more than once? |
| Pick one fix | 5 min | What single change (checklist item, stock minimum, intake question) prevents the top repeat? |
| Check last week's fix | 2 min | Did the callbacks it targeted go down? |
Track the monthly callback rate on the same screen as your other core numbers. Our guide to the six numbers every HVAC owner should see daily covers how to keep that view simple.
Should callback rate be tied to technician pay?
Use it carefully. Penalizing callbacks directly tends to teach techs to stop *recording* them, which destroys the data. A safer pattern:
- Review callback rate by tech on a rolling 90 days, privately.
- Pair a high-rate tech with a low-rate tech on the job types that drive the gap.
- If you bonus on it, bonus the team on the shop-wide rate, or reward improvement, rather than docking pay per callback.
- Never count callbacks caused by part failure or missing intake data against the tech.
How does JobOpsPro help track callbacks?
JobOpsPro keeps customer, equipment, and job history in one place, so a return visit can be booked against the right customer and system and checked against the original repair, photos, and notes before the tech rolls. Jobs move from the dispatch board to the tech's phone and back to invoicing without re-entry, and the books sync to QuickBooks Online.
It costs $25 per user per month with every module included. See pricing, or explore how it works for HVAC and plumbing shops.